
P2 Explain the resources available to a project manager.
People:
This is the people in the project like the local residents and what there view is on the build. This means that weather the local residents of the area where they are planning to do the build, this is there views weather they think it will help the area and weather they are happy with them building it there. It is also the stake holder in the project, This means who is going to pay for the project and weather they are happy in giving money for the project to be done. it is also weather they will be getting any money back for investing in the build, in addition why would they invest in it and what are the benefits.
Stakeholders:
Stakeholders is the people who will own the build and who will be using the build when it is finished. Stakeholder consist of the Customers, owners, environment and the actors, These mean:
Customer: the people who will be using it, for an example if they was to build a new car park, a customer would be the people who would be using it once it is finished.
Owners: the people who will be paying for it to be done and built.
Actors: These are the people who will be building the the project and changing plans for it to be built so that it is suitable for what it is being used for.
Project Specifications:
This would be how long it is going to take to build and how many people would be using the project once it is finished, this is also how much it is going to cost, this all means like how much would it cost for the project to be built and completed and how much it costs for the to hire the people to do the job. for an example if they was building a 5 story car park how much it would cost to hire the people to be building it and how much for the support beams to be built and put into place. in addition it is also how long it would take to get the beams made and put into place. This can also be an issue because if you hired people to put the beams in place but the beam did not arrive on time you would be paying for people just to sit around doing nothing.
Project Planning:
This is the part where they are start planning who is doing what and when and start deciding where the milestones are set. for an example when the final floor gets built that would be a milestone.
Information needed:
This is the bit where you get the information about the project and how many people would be using it, and in the next year how many people would be using it and the years to come. This is also the reliability that it would be used a lot and would actually turn in money.
Land/Place:
This is where they would be using to build the project and weather it would cause and problems with the surrounding, for an example if it would be knocking down a school that is being used for this to be built and weather it would be built and any important parts of equipment. an example is if it was being built on a electrical supply and water so that if the hit it, it would knock out all the power and water in that area.
Capital:
This insists of the liquid assets and hard assets, Liquid assets is something that you can buy and can be quickly sold on at a later point. like a cement mixer you would need that for building the project but once it is finished you can easily sell it on, where as a hard asset would be something that you would have to keep hold of. For an example a piece of land that you have bought to build the project on, also the actual project .
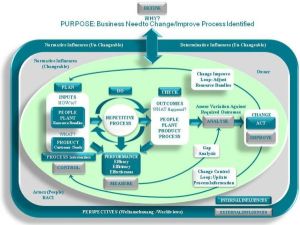
Image from:
http://www.bristol.ac.uk/eng-systems-centre/images/research/paulgibbons.jpg
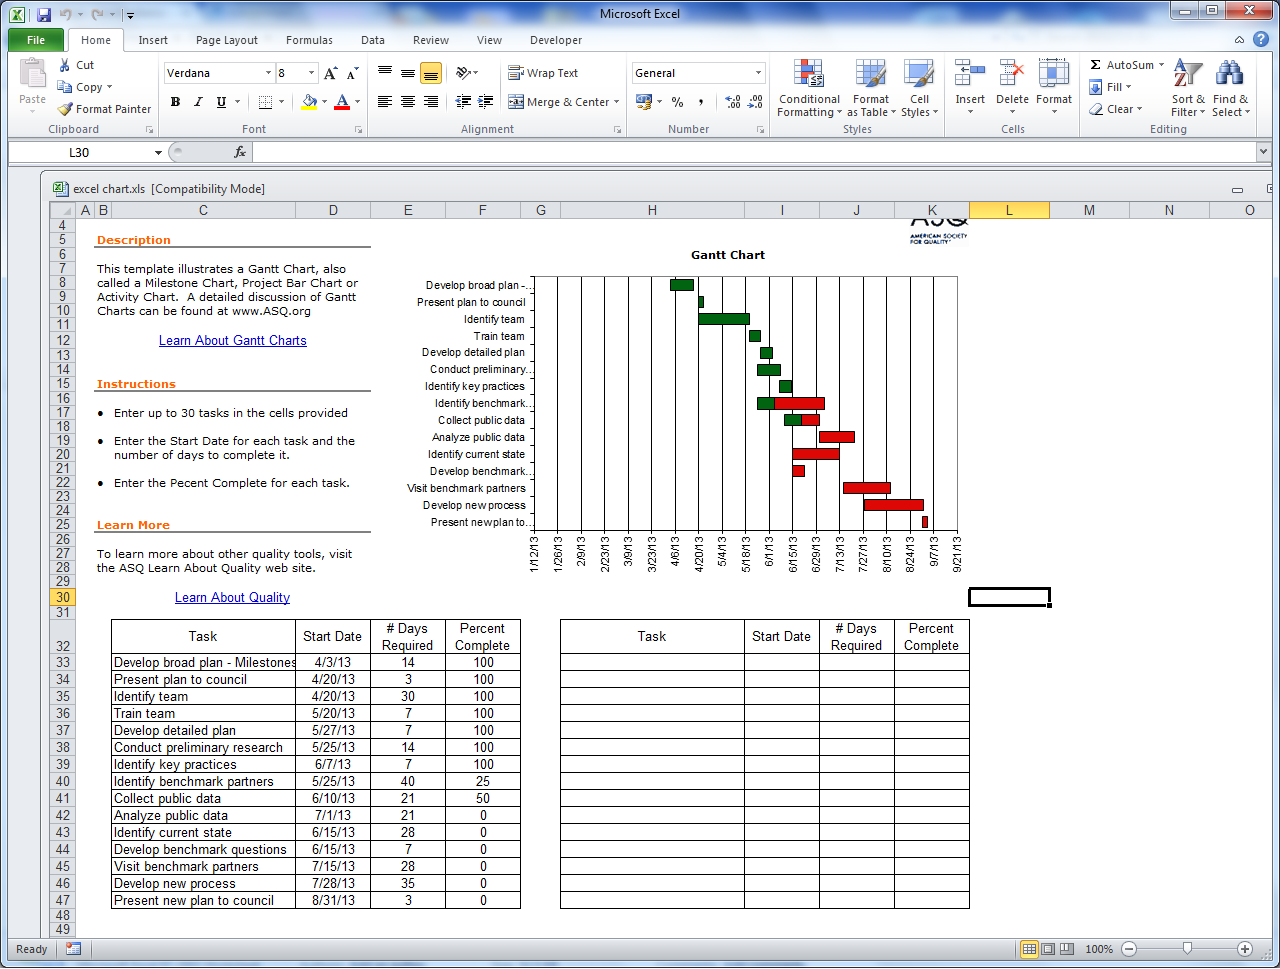
Gantt:
With this drawing you can make much more accurate versions that are more ideal to use because they with give you a more accurate reading.
A Gantt Chart is a chart that shows you how much work done or the amount of production completed in a certain amount of time of the period of time that has been set for them to be completed in. it is also used to show different stages in the project and that it shows the project in stages and shows parts of the planning
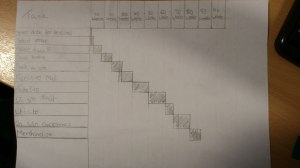
Pert:
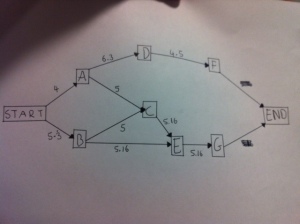
This is the PERT diagram that i have done. The shows the processes in a project. Also shows the critical path on a project which means the one that is most important and will take the longest. The nodes in the diagram are the parts that display how long that part of the project will take to complete and do.
Also shows the risk on how long it can take. for an example, B stands for Best time, M stands for most likely, P stands for Pessimistic.
The difference is that the PERT diagram is more technical and is more accurate in the where as a gantt diagram is more are guessing when it will be finished. However i prefer the Gantt chart because it is much more easy to understand and to draw and make you own.
